Final Report
Quick Links (for easy page navigation)
Acknowledgements
Contents
Executive Summary
Introduction
Problem Statement
Method of Solution
Results
Conclusions
Recommendations
References
Titles of Appendices
Appendix 1
Appendix 2
Appendix 3
Appendix 4
The Plausible Spread of the Smallpox Virus
As Related to Biological Warfare
Final Report
by
Dia Lewis, Junior
Lauren Webb, Junior
Silver High School, Silver City, NM
Spring 2002
Adventures in Supercomputing
Team Number 088
Teachers: Mrs. Peggy Larisch
Mrs. Joy Garcia
Mentors: Mr. Roeland Hancock, C++
Dr. Leon Arriola, Mathemathics,Programming, Research
Acknowledgements
The authors of this project wish to acknowledge the help and support of the following individuals. These kind people have been positive and devoted influences throughout our project. They have guided us in the overall right direction, put up with countless questions about C++ programming, assisted us with development of our computer code, and provided suggestions in the preparation of this report. They never hesitated to spend their valuable time with us explaining concepts and tackling the problems we encountered.
Ø Dr. Leon Arriola – Professor, Western New Mexico University, Mathematics
Ø Mrs. Peggy Larisch – Teacher, Silver High School, Advanced Computer Studies
Ø Mrs. Joy Garcia – Teacher, Silver High School, Physics and Chemistry
Ø Mr. Roeland Hancock – Student, Silver High School, C++ programming
Ø Mr. Barry Estes – Miscellaneous assistance and guidance
return to top of page
CONTENTS
E.0 Executive Summary
1.0 Introduction
2.0 Problem Statement
3.0 Method of Solution
3.1 Mathematical Methods
3.2 Computational Methods
4.0 Results
5.0 Conclusions
6.0 Recommendations
7.0 References
Appendix 1: C++ Code
Appendix 2: Graph of Results
Appendix 3: Cellular Automata Neighborhood Types in a Rectangular Lattice System
Appendix 4: The Coordinates of Cardinal Directions
return to top of page
E.0 Executive Summary
Today’s society faces an ever-increasing threat of biological warfare. Technological developments and increasing hostilities towards the United States have stemmed these fears. It is also thought that several stocks of the smallpox virus are contained in unknown locations. Biological warfare is especially frightening since, with the eradication of smallpox in the 1980’s, vaccinations and their production, have ceased. This means that little residual immunity remains. Also, the United States is thought to have only enough vaccine to immunize about one third of our population.
The problem that arises when trying to predict the spread of a disease is how it will behave realistically. Since it is impossible to witness a real world simulation, a computer generated one is the only realistic means of obtaining data that could predict the spread of the disease. The key factor when trying to predict the spread of a biological agent is to know how its hosts are going to migrate throughout their environment. Once this is established, transmission rates can be applied to the population to later determine the migration of the disease. Of course, that is no trivial task. The main focus of this project is modeling the behavior and movement of the carriers of the disease, or people.
This is attained by creating a program to generate a series of coordinate positions that may be interpreted to mimic the movement of a person. The results, when displayed on a coordinate plane graphically, establish a migratory pattern comparable to the movement of a human. This is the basis of a spread of a disease, in that the migration of the disease will directly relate to the movement of its host.
return to top of page
1.0 Introduction
1.1 Purpose
The threat of biological warfare in today’s society is ever increasing. In addition to technological developments and increasing hostilities toward the United States, it is believed that several stocks of the smallpox virus are unaccounted for. It is quite possible that there are stocks of the virus under the control of unemployed scientists who worked for the former Soviet Union. The possibility of a biological attack grows each day. The major problem that the United States faces is the lack of an adequate amount of vaccine. If an enemy country implored smallpox as a biological weapon, less than one third of the population would be vaccinated, and they would only be vaccinated under the direct control of the United States government and its agencies. The results of such an attack could be devastating. A question that arises when trying to predict the spread of the disease is how will it behave in a changing environment. A simulation is the only realistic way to model a problem such as an epidemic. The very nature of a biological outbreak makes it impossible to witness actual results. Therefore, as mentioned previously, simulation is the nearest method of obtaining realistic data. Furthermore, simulating the movement of the hosts of the disease is key in predicting the spread of an epidemic.
1.2 Scope
The intention behind simulating a smallpox outbreak is quite simple. This intention is to use a broad knowledge of the virus and its behavior to infer an amount of people that will be infected with the disease. In order to develop such a project, one must first consider a vast array of factors. Among the most important of these factors is the actual movement of the disease. Intrinsic to the movement of the disease is the inevitable movement of the host, in this case, people. To be able to simulate the seemingly random movement and interaction of people will directly lead to the observation of the movement of a disease. As related to a computer project, this “migration” is the elementary factor to understanding how a disease could move. Once this idea is understood, one must have knowledge of the behavior of the disease, such as incubation period, mortality rate, etc. One must then use this information in correspondence with the migration program in order to find out how many people could be infected by an outbreak. This then gives the program the significance of determining theoretically how drastic an outbreak could be, and determining how urgent preparations for an outbreak really are.
1.3 Computer Program
The most essential process involved when creating a simulation of the spread of a virus is just that, the spread. In order to track how the virus spreads, the movement of the hosts must be predicted and recorded. Using the C++ programming language, we have created a program that will display workable data that may be interpreted graphically using a program such as Mathematica in order to create visual representation of the migratory patterns. Our C++ program outputs coordinates designed to represent the location of three different subjects as they randomly migrate through an environment. Mathematica allowed us to input this data and create a visual display of the random walks.
return to top of page
2.0 Problem Statement
The plausible outbreak of smallpox as a biological weapon is a serious threat to the citizens of the United States. By better understanding the spread of the disease, should an outbreak occur, the nation will be more adequately prepared to deal with its effects. It is necessary, then to understand the general motion of people. To understand how many people the disease will affect will determine how much vaccine should be constructed and stockpiled. This report refers to one team’s efforts to simulate the spread of the smallpox disease. Mathematically, processes of random motion are used, while computationally these processes are transformed into workable migratory data. These techniques provide for the substance of a project that may be a useful building block on which to build a very significant program in a time familiar to war and the threat of biological warfare.
return to top of page
3.0 Method of Solution
3.1 Mathematical Model
A problem encountered, as previously stated, when trying to model the spread of an epidemic is representing the physical migration of the disease through its hosts. In order to model the spread of this disease one must, then, first take into account the movement of the hosts. When modeling the movement of people, as in this program, one method is to use what is called a random walk. Although in reality the movement of people is not completely random, and some patterns may be demonstrated, this provides an adequate simulation. In order to create a random walk, a random number generator must first be created and then utilized.
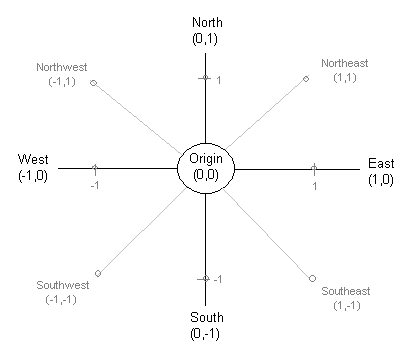
The random number generator generates a number for usage using a seed from the system clock. Mathematically, the generated number is divided by a maximum number (described in the section “Computational Methods” below); therefore, a number between zero and one is created. This number then stipulates whether to display a number “-1,” “0,” or “1.” The specific code may be found in Appendix 1, while the processes of this are further outlined in the computational methods section below. Now, the process is repeated. The outcome of all of these processes are two numbers, each one either “-1,” “0,” or “1.” These numbers represent “x” and “y” coordinates, and are thus paired. Each set of numbers is established to represent the motion of one person. This new “x” and “y” pair of negative ones, zeroes, and positive ones is then added to the coordinates of the origin, using simple addition. The sum of these creates a new pair of coordinates, which determine the direction in which the person moves. Each person has the ability to move north, south, east, west, southeast, southwest, northeast, northwest, or to stay at its current location. (Please refer to Appendix 4 to view a graphical representation of how direction is determined.) This program provides the mathematical structure on which to base more complex processes which will indubitably lead to more complex programs (See section 6.0 Recommendations).
3.2 Computational Methods
When modeling the movement of subjects, there are different allowances and restrictions that can be put into place for their range of motion. The system used in this program consists of a cellular automata lattice neighborhood. Briefly, cellular automaton involves a discrete system of lattice sites having initial values. Based on the values of their local neighborhood sites, these sites progress in time steps while each site assumes a new value. A neighborhood consists of one site and its nearest neighbor sites. There are two common types of neighborhoods in a rectangular lattice system, the von Neumann and Moore neighborhoods.
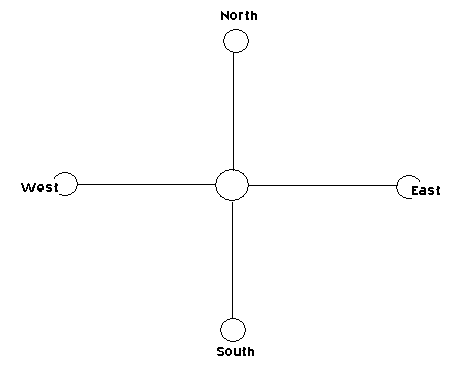
A von Neumann neighborhood contains one site and its four nearest neighbor sites. These neighbors are located in the cardinal directions, north (above), south (below), east (right), and west (left) of the site.
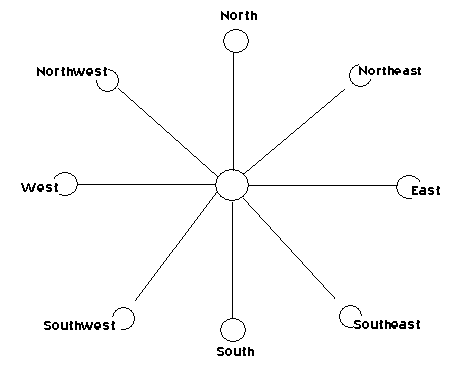
A Moore neighborhood contains one site and its eight nearest neighbor sites. These neighbors are located north, south, east, west, northeast, southeast, northwest, and southwest of the site. (For graphical representation of these two types of neighborhoods, please see Appendix 3).
To represent the most realistic type of movement, the Moore neighborhood is used in this project. This project models the movement of three subjects, all beginning at the origin of a circular coordinate plane representing a physical area in which the subjects can move. As stated in the above section “Mathematical Model,” a random number generator is used that extracts a seed from the computer’s system clock. This is due to the fact that the system clock changes consistently, and will offer a different seed each time the program is executed, creating a more truly random number. The number generated is within the range from zero to RAND_MAX (which is a constant defined in the standard C file
return to top of page
4.0 Results
4.1 Data Interpretation
The principle behind the results of this program is the movement of the hosts of the smallpox disease, and therefore, in a way, the migration of the disease. The program in question uses simple mathematical operations in order to output a series of coordinates that are interpreted to establish and track movement. This process may be done for any amount of iterations and for any amount of people if the code is manipulated correctly. Although not directly the original intention of team 088, this is a workable program that outputs results that may be interpreted to demonstrate the migration of an organism, be it a human carrying smallpox, or smallpox itself.
4.2 Graphs
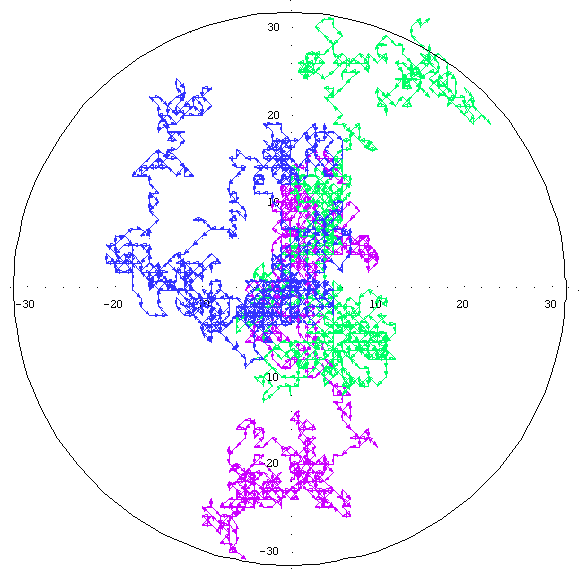
The program in question displays sets of coordinates. Using a graphics program, such as Mathematica, this data may be translated into a graphic display (see Appendix 2). In Appendix 2, a representation of three separate people executing a random walk is shown. (The actual output results of the program are included in Appendix 2, under the file heading posdata.dat.)
return to top of page
5.0 Conclusions
5.1 Mathematical Models
Although based on simplistic mathematical concepts, the models used are significant in creating an adequate display of the migration of a certain unit. This unit may represent any person, particularly one infected with smallpox, moving throughout a given area, which may be geographically represented as a city, state, or even a country. Therefore, it is a hypothetical simulation of how people move. First, the division of a random number by the maximum possible number is the substance for generating the coordinates. The addition of these points causes the unit to move a certain distance to another point, which physically occurs everyday, as seen with the action of moving from point “a” to point “b.” So, in fact, the results that are created do simulate an actual environment, by determining the plausible migration of a substance or organism.
5.2 Computer Program
The intention in constructing our program was to create a program that simulated the spread of a disease. Our program does, indeed, calculate the spread, not of the disease, but of the hosts in their environment. Once we began to understand the concepts and principles of migration, we realized that the movement of hosts was a basic, yet essential aspect of our simulation. Therefore, our program provides a basic pattern of migration, which may be later used for the spread of smallpox.
5.3 Results
The results that are output each time that the program is executed vary. This is because the processes deal with a random number generator, which alters the numbers that are output. The results created by this program are an appropriate representation of how a person, hypothetically infected with smallpox, could move through a population. This is the basis for understanding the spread of an epidemic, especially if other data is entered into the program (see 6.0 Recommendations in this paper for future plans).
return to top of page
6.0 Recommendations
Established already is a workable program to calculate the random walks of three subjects. The original intention of this project was to calculate the spread of a disease through a population. This, however, is not a trivial issue. Epidemics are impossible to simulate in real world conditions, making computer programs one of the only means of obtaining useful data on the behavior of a disease. In order to calculate the disease’s spread, data is generally used from previous outbreaks and epidemics. Smallpox, historically, has behaved erratically when it comes to transmission rates. Rates have fluctuated from one to 20 secondary infections per primary case. This makes it very difficult to analyze the behavior of the disease from the optimal viewpoint, on a case-per-case basis where each person becomes infected based on several variables. These variables could include age, occupation, or the time of year in which the outbreak occurs.
Therefore, a macroscopic viewpoint, using general rates of infections, transmission, mortality, and recovery is recommended. A method commonly associated with macroscopic calculations is the S-I-R method. This method separates a population of people into three different categories. Those in the ‘S’ category are susceptible because they have never had the disease and can catch it, those in the ‘I’ category are infected with the disease and are contagious, and those in the ‘R’ category have had the illness and are removed from the model either through death or immunity. Smallpox, however, goes through an incubation period, which averages 12 days, but can range from 7-17 days. This would complicate the model somewhat, creating an S-I(nc)-I(c)-R model. Two new states would need to be created from the previous ‘I’ category. These would be an ‘I(nc)’ where the patient is infected but not yet contagious, and an ‘I(c)’ where the patient is infected and contagious. Then, since the incubation period can last anywhere from 7-17 days, a random number generator could be utilized to predict the “probability” of a host moving from ‘I(nc)’ to ‘I(c).’
One way of tracking the movement of hosts between states would be to use a Markov Chain. A Markov Chain is a special class of state model that consists of a collection of states (S-I-R), but is able to model the probability of transitions between states. Conditional probability is the term commonly used when discussing the probabilities associated with Markov Chains. This means that the probability of something happening relies completely on the fact that something else has already happened. For instance, if a patient moves from the susceptible to the infected state over one iteration, one day in this case, they will not be able to move to the removed state after the next iteration. With Markov Chains one must establish a set transition matrix. A transition matrix is a matrix of conditional probabilities that a case will move from one state to another. Then, using matrix multiplication, the transition matrix is applied to the population matrices. This is repeated over several iterations to form the spread of a disease throughout a population. Combined with a random movement program, this model could hypothetically obtain realistic results.
The next step in calculating the movement of a disease throughout a population could be to include a user interface. This would create a workable program with great possibilities. Users would be able to enter a certain population size and the limitations of that population (movement wise) to create a view of how the disease would spread in a specified area. Unfortunately, time stipulations have transformed this project into a seemingly two-year endeavor. We realize that we are unable to use this exact project in next year’s Challenge; however, we wish to develop our former ideas and continue working with biological and epidemiological simulations.
return to top of page
References
1. Adams, Joel, Sanford Leestma, and Larry Nyhoff. C++ An Introduction to Computing, Second Edition. Prentice Hall, Inc. Copyright 1998.
2. Gani, Raymond and Steve Leach. “Transmission Potential of Smallpox in Contemporary Populations.” Macmillan Publishers. 2001.
3. Hubbard, John R. Ph.D. Schaum’s Outline of Theory and Problems of Programming With C++. McGraw-Hill Companies, Inc. Copyright 1996.
4. Rosenstock, Angela. “Beginning C++.” Information sheet from an AIS Seminar. June 1998.
5. Swift, Randall and Douglas Mooney. “A Course in Mathematical Modeling.” Mathematical Association of America. 1999.
6. http://cryptome.org/smallpox-wmd.htm
7. http://library.cs.tuiasi.ro/cryptography%20-%20security/learn-encryption-techniques with-basic-and-C++/ch08/387-391.html
8. http://math.smith.edu/Local/cicchap1/node3.html
9. http://www.bu.edu/iscip/vol9/Alibek.html
10. http://www.cdc.gov
a. http://bt.cdc.gov/Agent/Smallpox/Smallpox.asp
b. http://www.cdc.gov/mmwr/preview/mmwrhtml/rr5010al.htm
11. http://www.stephenwolfram.com/publications/articles/ca/85-two/2/text.html
return to top of page
Appendix 1: C++ Code
Appendix 2: Graph of Results
Appendix 3: Cellular Automata Neighborhood Types in a Rectangular Lattice System
Appendix 4: The Coordinates of Cardinal Directions
return to top of page
***APPENDIX 1 AVAILABLE ON "PROGRAM CODE" PAGE. SEE "PROGRAM CODE" PAGE BY CLICKING HERE***
return to top of page

*Each color represents a different person executing a random walk, mapped with small arrows indicating direction
return to top of page
A von Neumann neighborhood

The middle circle represents the initial site, while the outlying ovals (labeled with directions) represent the possible sites in which the subject can move.
A Moore neighborhood

As with the previous neighborhood, the middle circle represents the initial site, while the outlying ovals represent possible sites in which to move.
return to top of page
Appendix 4: The Coordinates of Cardinal Directions

*The coordinates represent a typical output of our program, and this is a graphical demonstration of how to interpret in which direction the subject is moving.
return to top of page