Figure 0. An ear with earwax. The earwax represents the moral and economical blockage caused by the complexity of cargo loading. Our project is represented by the off-screen water pick preparing to clear the blockage and revive the ethical and financial ear of the nation.
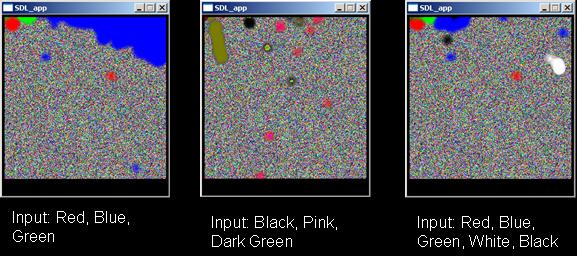
Figure 1. A few examples of our RGB SOM before implementing a changing update radius.
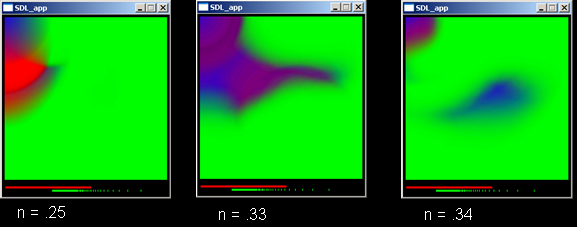
Figure 2. Our RGB SOM after implementing a decreasing update radius. In these images, n is the exponent in the denominator of the function. Each of these starts the same and runs for 130 iterations using red, green, and blue as the inputs. The red bar at the bottom of each view helps to monitor the progress of the SOM, with one pixel added to its length for each iteration. The green markings at the bottom show the update radius and move left over time as the update radius decreases.
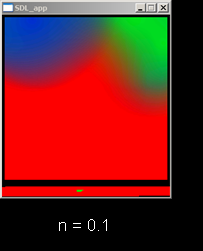
Figure 3. This SOM ran for 3250 iteration and stabilized as it appears here.
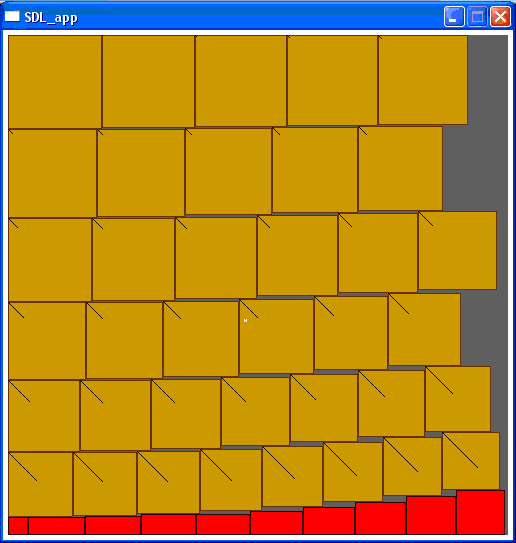
Figure 4. In this image, a set of 75 packages has been loaded into a hold by size. It was sequenced using probabilities of 0 for all methods except greedy approximation by size. The brown packages were all loaded successfully and the red packages did not fit. The white dot near the center shows the center of mass and the diagonal lines increase in length for packages loaded later in the loading sequence. In this load, the center of mass would have been favorable, but the packages haven't all been loaded, so the sequence is not sufficient.