Home
Background Information
Research Paper
Graphs
Charts and Statistics
Program
Charts and Statistics
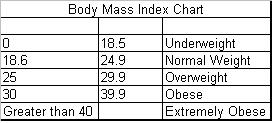
The chart below is a Body Mass Index Chart.

This chart shows the number of injuries in each category, as well as its total percentage of injuries received. The BMI of the Average and Average Age are also show for each gender.

The chart below contains all of the data collected for this project. This data is separated by gender and type of injury.
