

Results


Our model this year has produced more accurate results than both last year’s model and other models
like BACest and cBAC, as demonstrated by a root-mean-square analysis (lower numbers are better because
they represent values closer to the actual value).
| Root-Mean-Square Analysis of Predicted Values | ||
| MODELS | Blood Alcohol Content | |
| Males | Females | |
| Our Model | 0.009 | 0.014 |
| Our Model in 2002-2003 | 0.011 | 0.017 |
| BACest | 0.015 | 0.017 |
| cBAC | 0.013 | 0.016 |
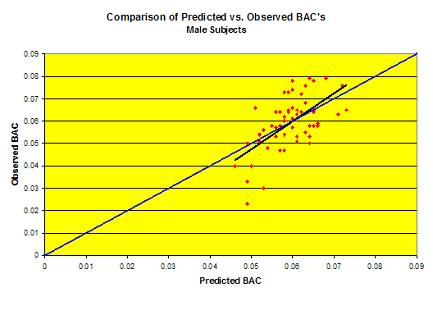
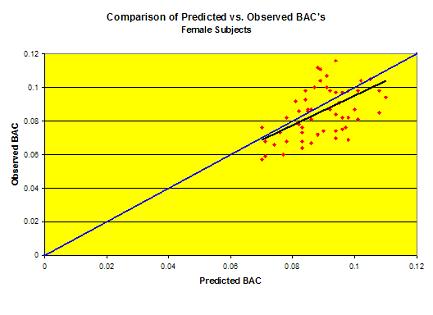
The following graphs plot our model’s predictions compared to the actual value for each subject. For an exact prediction, the dot will lie on the blue line. If the prediction overestimates the BAC, the dot will lie below the line, and above the line if the program underestimates the BAC. The black line is a linear regression of the data.