Adventures in SuperComputing - Summer Teacher Institute
Example Site
Results and Conclusions
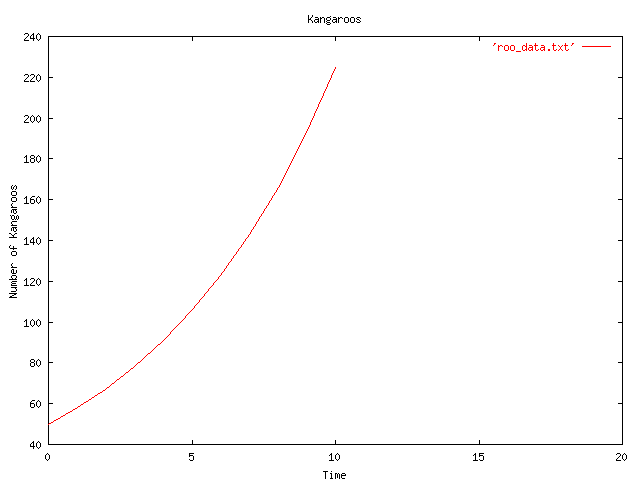
Plot a time history of the 'roo population. Comment on your results. Can you think of ways to refine your model?
Sample Data (Output from the Java Program)
| Interval | Population |
|---|---|
0 |
50 |
1 |
58 |
2 |
67 |
3 |
78 |
4 |
91 |
5 |
106 |
6 |
123 |
7 |
143 |
8 |
166 |
9 |
193 |
10 |
225 |
Sample Graph (Gnuplot graph of our Data)

