


|
We ran MATLAB many times altering the various variables each time. The grap hs were displayed on the client computer by using another unix machine or X-Win3 2, an X application emulator for Windows. The following are the initial input v ariables:
Semi-major axes:
Distance from ellipsoid geometric center to the center of gravity:
Mass Moments of Inertia:
Mass of ellipsoid:
Gravitational pull:
Air resistance coefficient: Our first simulation gave the roll and pitch a .5 degree initial value, 20 seconds to run, with all other conditions being set to that of a normal rattleback. (It also g ave the celt an initial angular velocity about the perpendicular axis 0 f-5 rad. sec. ) After running the program, graphs which displayed behavior similar to the rattleba ck were produced. Below are the results from the simulation using inputs from the ab ove variables.
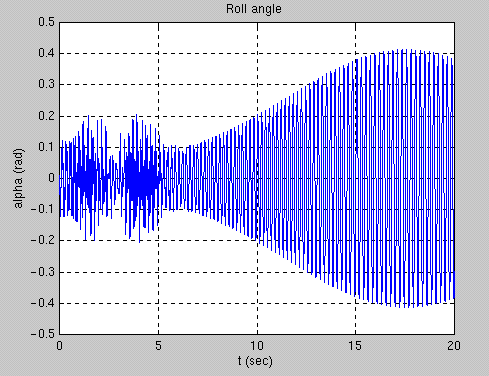 The graph above shows the roll angle, a, over a twenty-second time period. A strange behavior can be noticed from 0 to 5 seconds. High frequency and rapid changes in amp litude occur at this time in the simulation. The virtual rattleback is rapidly rockin g back and forth across its short axis and along the long axis of its surface.
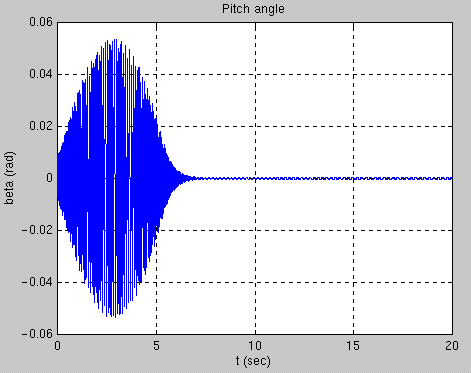 The second graph displays the pitch angle, b, over the same twenty-second time period . From zero to eight seconds, the rattleback rocks along the long axis on its surfac e, steadily increasing in amplitude, then dissipating to almost zero. The final twel ve seconds show little movement along its axis as the movement is transferred to the vertical axis, and the yaw of the rattleback.
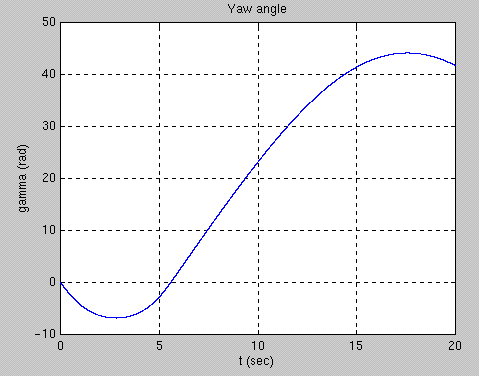 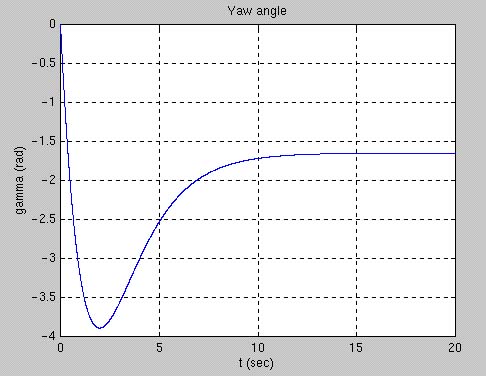 The yaw angle is shown in the first graph above. This displays the phenomena of spin reversal. The rattleback begins to spin in the negative direction, but reverses dir ection at about six seconds. When extended out over a longer period of time, the beh avior would repeat itself (assuming no slipping and no energy loss). In the second gr aph, we added sigma, which represents air resistance. This slows the rattleback down and eventually brings it to a complete stop.
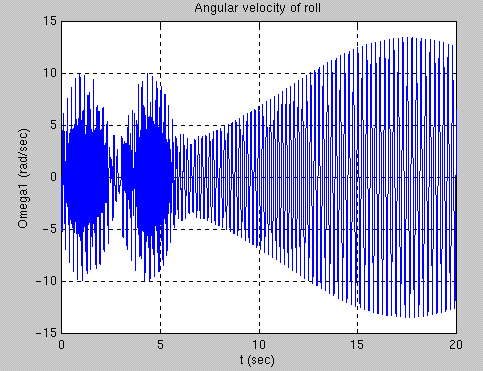 This image displays the angular velocity of roll in radians per second. Again, beati ng patterns are seen in the first six seconds showing the change of angular velocity over time.
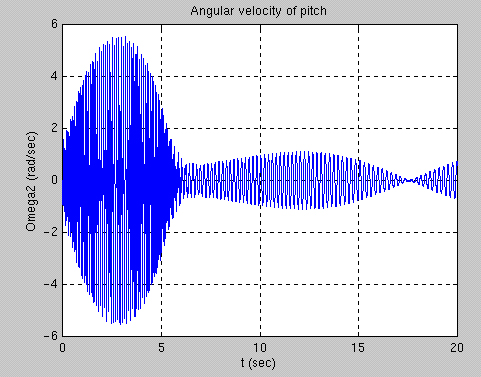 The graph shown above displays the angular velocity of pitch, or how fast the rattleb ack is rotating around the short (vertical) axis. It decays to a low value as the rat tleback begins to rotate around the z-axis. Most of the rotation has stopped after si x seconds have passed, however, if the simulation is run longer it will repeat itself .
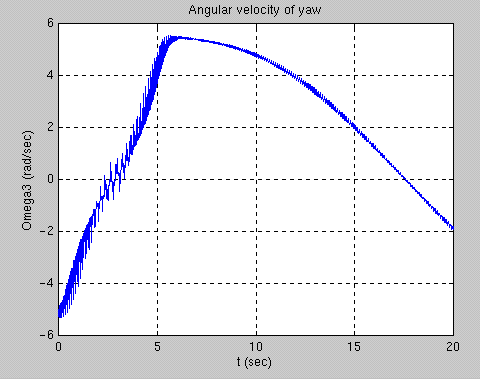 This graph demonstrates the angular velocity of the yaw as a function of time. The v elocity of the rattleback as it spins clockwise increases up until the reversal point , approximately six seconds after starting the rattleback, then it decreases in veloc ity until it is ultimately stopped by air resistance and/or friction.
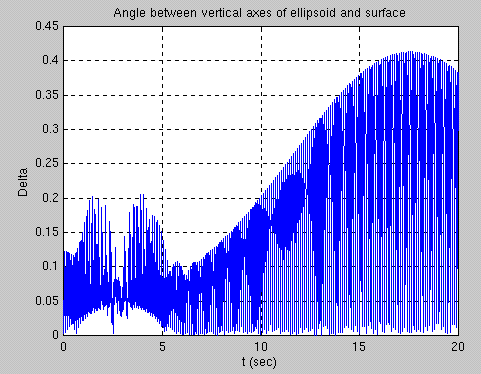 This graph represents the angle between the vertical axes of the ellipsoid and the su rface. In our simulation, the delta angle rocks back and forth as shown in the graph above.
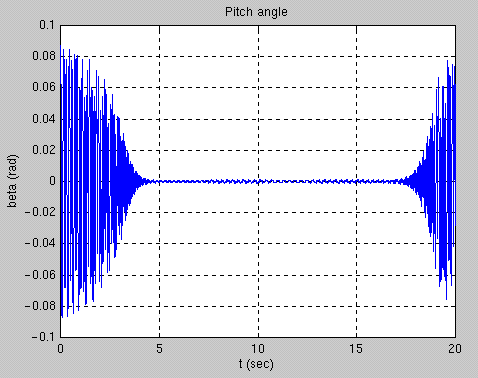 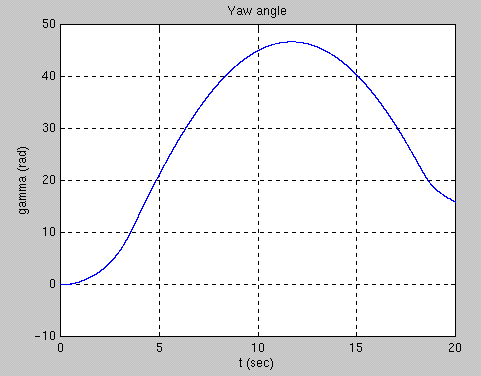 Here, we ran another simulation. However, the rattleback was started by pressing one of its sides along the a axis instead of spinning it. As shown in the graphs above, t he phenomena still occurs.
|
