Analytical Methodology
Mathematical Bases
The Susceptible-Infected(SI) model, as shown below, was recommended for use in the application of this computer program by a team mentor (Charlie Voss, Golder Inc.). Mr. Voss is a specialist and works with modeling complex systems both natural and engineered.
The basic SI model consists of five fundamental parameters; these are:
- contact rate(c)
- infectivity(i)
- susceptible population(S)
- infected population(I)
- and total population(N)
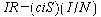
These variables are used to calculate the newly infected members of the population (IR) during each of the time steps. As the equation is run the susceptible population goes down and the infected population goes up. At first, the number of new infected increases each time; because a higher percentage of the population is infected more susceptible individuals come in contact with infected individuals. Eventually the susceptible population becomes small enough such that the new infected group within the population in each of the iterations cannot remain constant and begins to decline as shown in Figure 1 [1].
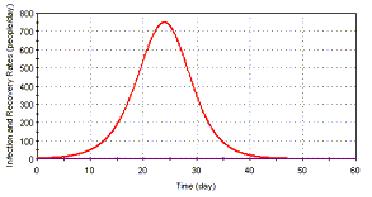
Figure 1 Time History of Infection Rate.
This rollover effect shown above is a trend that is repeated in most all epidemics. It is caused by the interaction of the susceptible and infected populations as the size of their populations increases and decreases throughout the spread of the disease. Although this trend can be found in epidemics in real world situations the curve is effected by many more variables i.e. a population with immunity to the disease, certain population members who are less likely to contract the disease. This curve is most applicable to epidemics that spread rapidly through a population, kill many of the population's members, and finally leave mostly immune members of the population.
The HIV/AIDS epidemic is unique because it can take years before an infected individual shows symptoms of the virus. This means instead of modeling the epidemic for days it must be modeled over many years. Since it needs such an extended modeling time other variables must be taken into account. These variables include birth and death rates for all populations (different age groups, infected, uninfected) in the simulation. Another problem large time steps created in the creation of the program is that people, after being born have to grow old and eventually die. To solve this problem different death rates were applied to each population group to reflect not only a population member's ability to die but also taking into account that individual's age. Also, there is approximately a 1% chance a person is born with immunity to HIV; therefore, in addition to adding age groups, a new population group called "unsusceptible" was added to the program.
In order to make the model more realistic during each time step, each person has a chance (determined using input variables) to have a child, die or become infected. Then each child born has a chance to be born susceptible, unsusceptible, or infected (if the parent is infected). When the program makes a decision it goes through this process: If a randomly generated number is less than the chance defined by the input variable then the event in question (birth, death, infection) takes place if the random number is greater than the chance the event in question does not take place. For example if the birthrate is 17 per 1000 and the random number (between 1-1000) is 15 a baby is born.
A few more examples of events that take place in the program are:
- (Sbr*2)*(uS/N*10)*100) The chance in 100000 a baby is born unsusceptible(uS). This finds the percentage of the population that is uS so if there are more uS in the population more uS babies are born.
- (IR0/S)*100000) The chance in 100000 this individual becomes infected. IR0 is calculated by the SI model.
Computer Applications
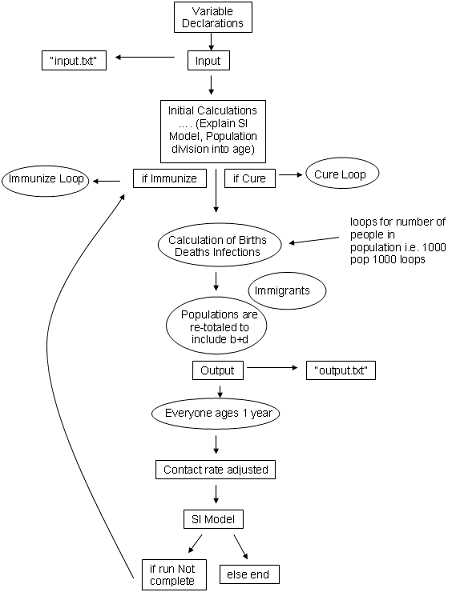
Figure 2
The program requires input from a file called "input.txt" (see Appendix 2). This file includes all of the parameters needed to run the program. It also allows you to control what is output from the program. All of the output from the program is put into a text file called "output.txt". This is done so the results can be imported into Excel to be graphed/analyzed. This program was developed entirely by Team 80. Most of the output was used for debugging.
For a complete explanation of the process of the program see Figure 2 for a flowchart of the program and Appendix 2 for the source code.
Many assumptions had to be made for the project. Most of them involve people's activities remaining consistent with how they are today. The following is a list of the assumptions that were made:
- Birth, death and immigration rates remain similar to what they are currently.
- There are no major population changes (due to war or a different disease).
- The virus does not adapt to changes in the populations.
- All members of specific age groups participate in similar activies.
- Immigration laws remain similar to what they are today.
|