Executive Summary
Introduction
Project Proposal
Analytical Methodology
Results
Conclusions
Future Work
References
Appendix 1
Understanding The Model
Appendix 2
Code, and Computations
Appendix 3
History of the AIDS Virus
|
Appendix 1
Understanding The Model and Program
Breakdown of Population Groups
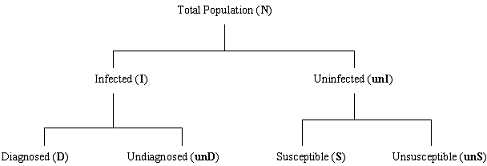
Each of the four main groups that compose the total population have different qualities that separate them from the other three population groups. These qualities include like likelihood of dieing, ability and likelihood of having children, chance of death, and ability to infect or be infected.
Diagnosed Population: higher death rate and lower birth rate than uninfected, can infect susceptible individuals
Undiagnosed Population: birth and death rate are the same as uninfected, can infect susceptible individuals
Susceptible Population: lower death rate and higher birth rate than infected, can be infected
Unsusceptible Population: lower death rate and higher birth rate than infected, cannot be infected
Each of the four major groups that make up the population are divided into age groups from 0 to 99. These age groups determine whether the individual can be infected, infect others, have children, or his/her likelihood of dieing.
0-14 Year Old Infected: cannot have children, have twice the normal infected death rate, cannot infect susceptible individuals
15-50 Year Old Infected: can have children, normal infected death rate, can infect susceptible individuals
50-99 Year Old Infected: cannot have children, twice infected death rate, cannot infect susceptible individuals
0-14 Year Old Uninfected: cannot have children, half the normal uninfected death rate, cannot be infected
15-50 Year Old Uninfected: can have children, normal uninfected death rate, can be infected if susceptible
50-99 Year Old Uninfected: cannot have children, twice the uninfected death rate, cannot be infected
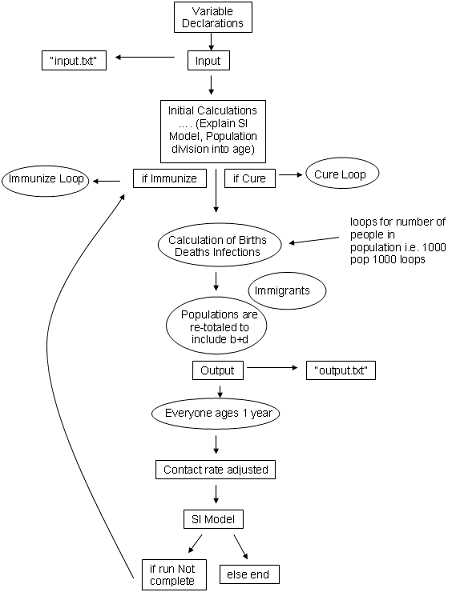
Program Flow Chart
Variables Used In the Program
Below is shown a list of the variables used in the program that are necessary to understanding the model.
Populations
N Total Population
uS Unsusceptible Population
S Susceptible Population
I Total Infected Population
dI Diagnosed Infected Population
udI Undiagnosed Infected Population
Births
Ib Total Infected Births
dIb Diagnosed Infected Births
udIb Undiagnosed Infected Births
uSb Unsusceptible Births
Sb Susceptible Births
Deaths
Id Infected Deaths
Sd Susceptible Deaths
uSd Unsusceptible Deaths
dId Diagnosed Infected Deaths
udId Undiagnosed Infected Deaths
Infections
IR0 New infected for that year
Various other Variables
Sbr Susceptible Birth Rate
Sdr Susceptible Death Rate
Idr Infected Death Rate
Ibr Infected Birth Rate
C Contact Rate/Infectivity
firstYearInfected People infected during the current time step of the program
popResponse Changes how the population responds to the infection
percentCured Percent of the infected population cured annually
percentImmunized Percent of the susceptible population immunized annually
totalInfectedDeaths Keeps a total of all deaths caused by infection
startPopulation Initial uninfected population
infectedAge An array that holds population totals for each age.
susceptibleAge An array that holds population totals for each age.
unSusceptibleAge An array that holds population totals for each age.
yearsSinceInfection An array that keeps track of how long a person has been infected.
Unmodified SI Model Illustration
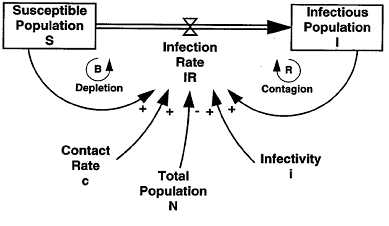
The graphic shown below illustrates the many factors that are dealt with in the process of modeling the two populations in the original SI Model [1].
The SI Model
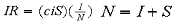
The original SI Model calculated the number of newly infected people(IR) each year. It took into account the size of the total population(N), the infected population(I), the susceptible population(S), the contact rate(c) of the uninfected with the infected, and the infectivity(i) of AIDS[1].
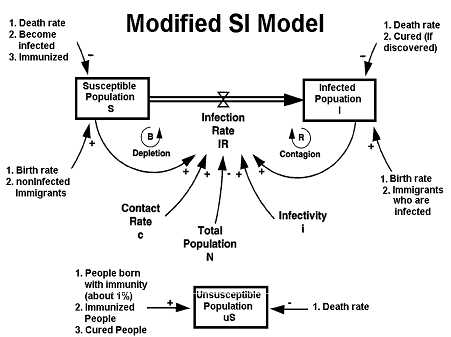
Modified SI Model Illustration
The graphic shown below illustrates the many factors that are dealt with in the process of modeling the four populations in the modified SI Model used in this program.
|